Introduction
If you’re reading this guide, props to you (no pun intended). By signing up for Hall of Fame Bets, you’re already well on your way to becoming a smarter and more data driven sports bettor.
Our goal at HOF Bets is to provide you with the analytics you need to bet with confidence, have fun with the process, and hopefully win more too!
If you are looking for more information on any of our other features, simply click its name and you will be directed to its respective tutorial.
Currently, we offer five tools per sport:
- Home
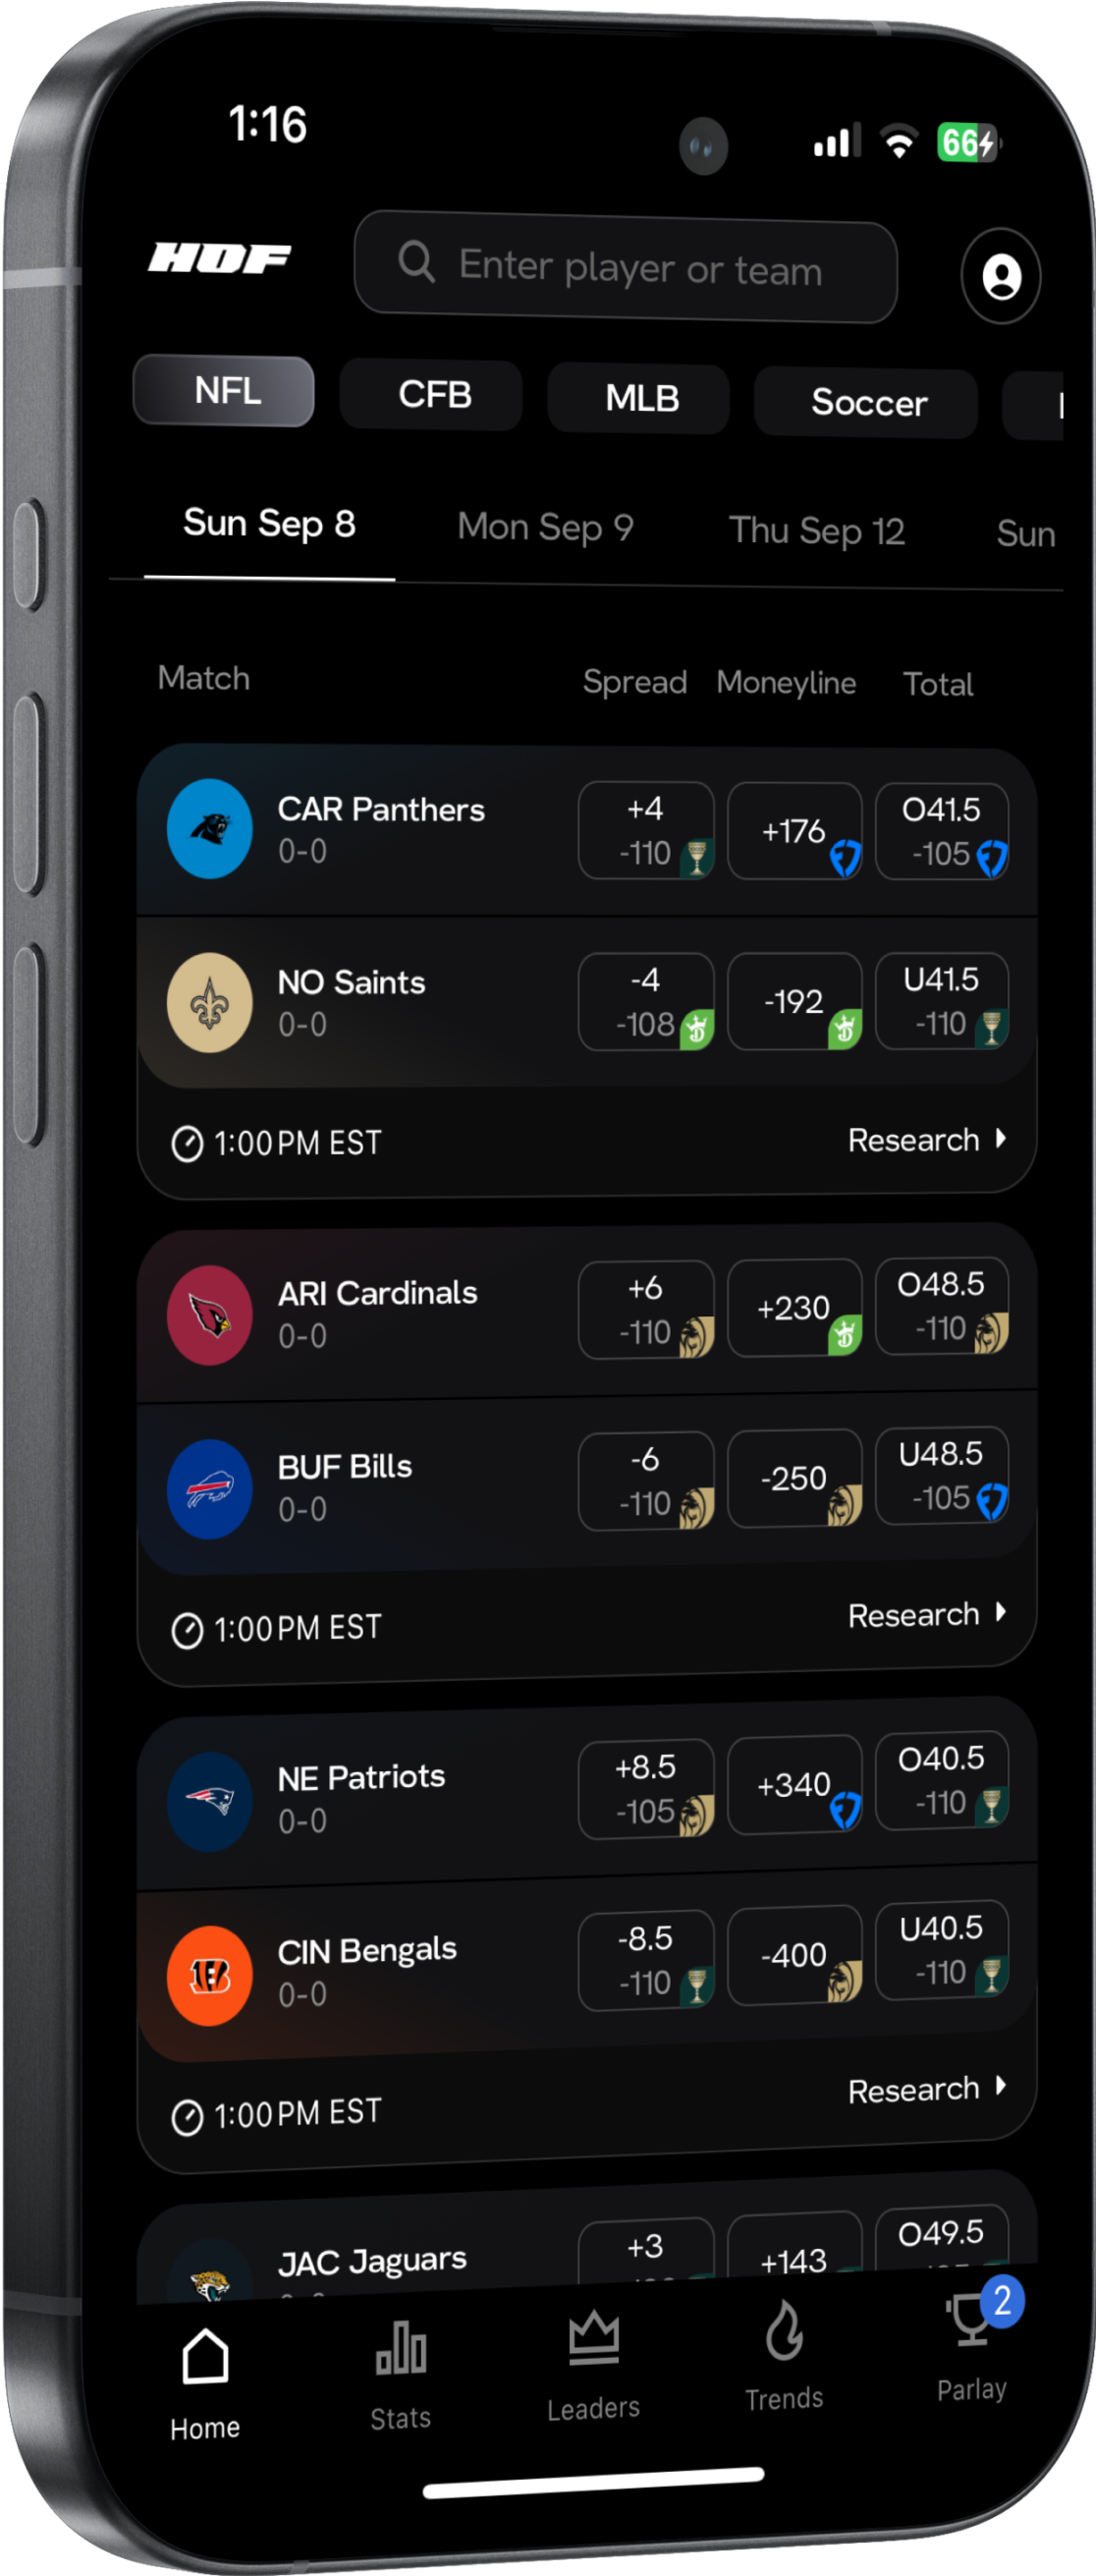
Get an overview of any and all upcoming games with the home page. Clicking on any game will give you a high-level overview of the matchup, breaking down the most crucial stats and highlighting the players to look out for.
- Deep Stats
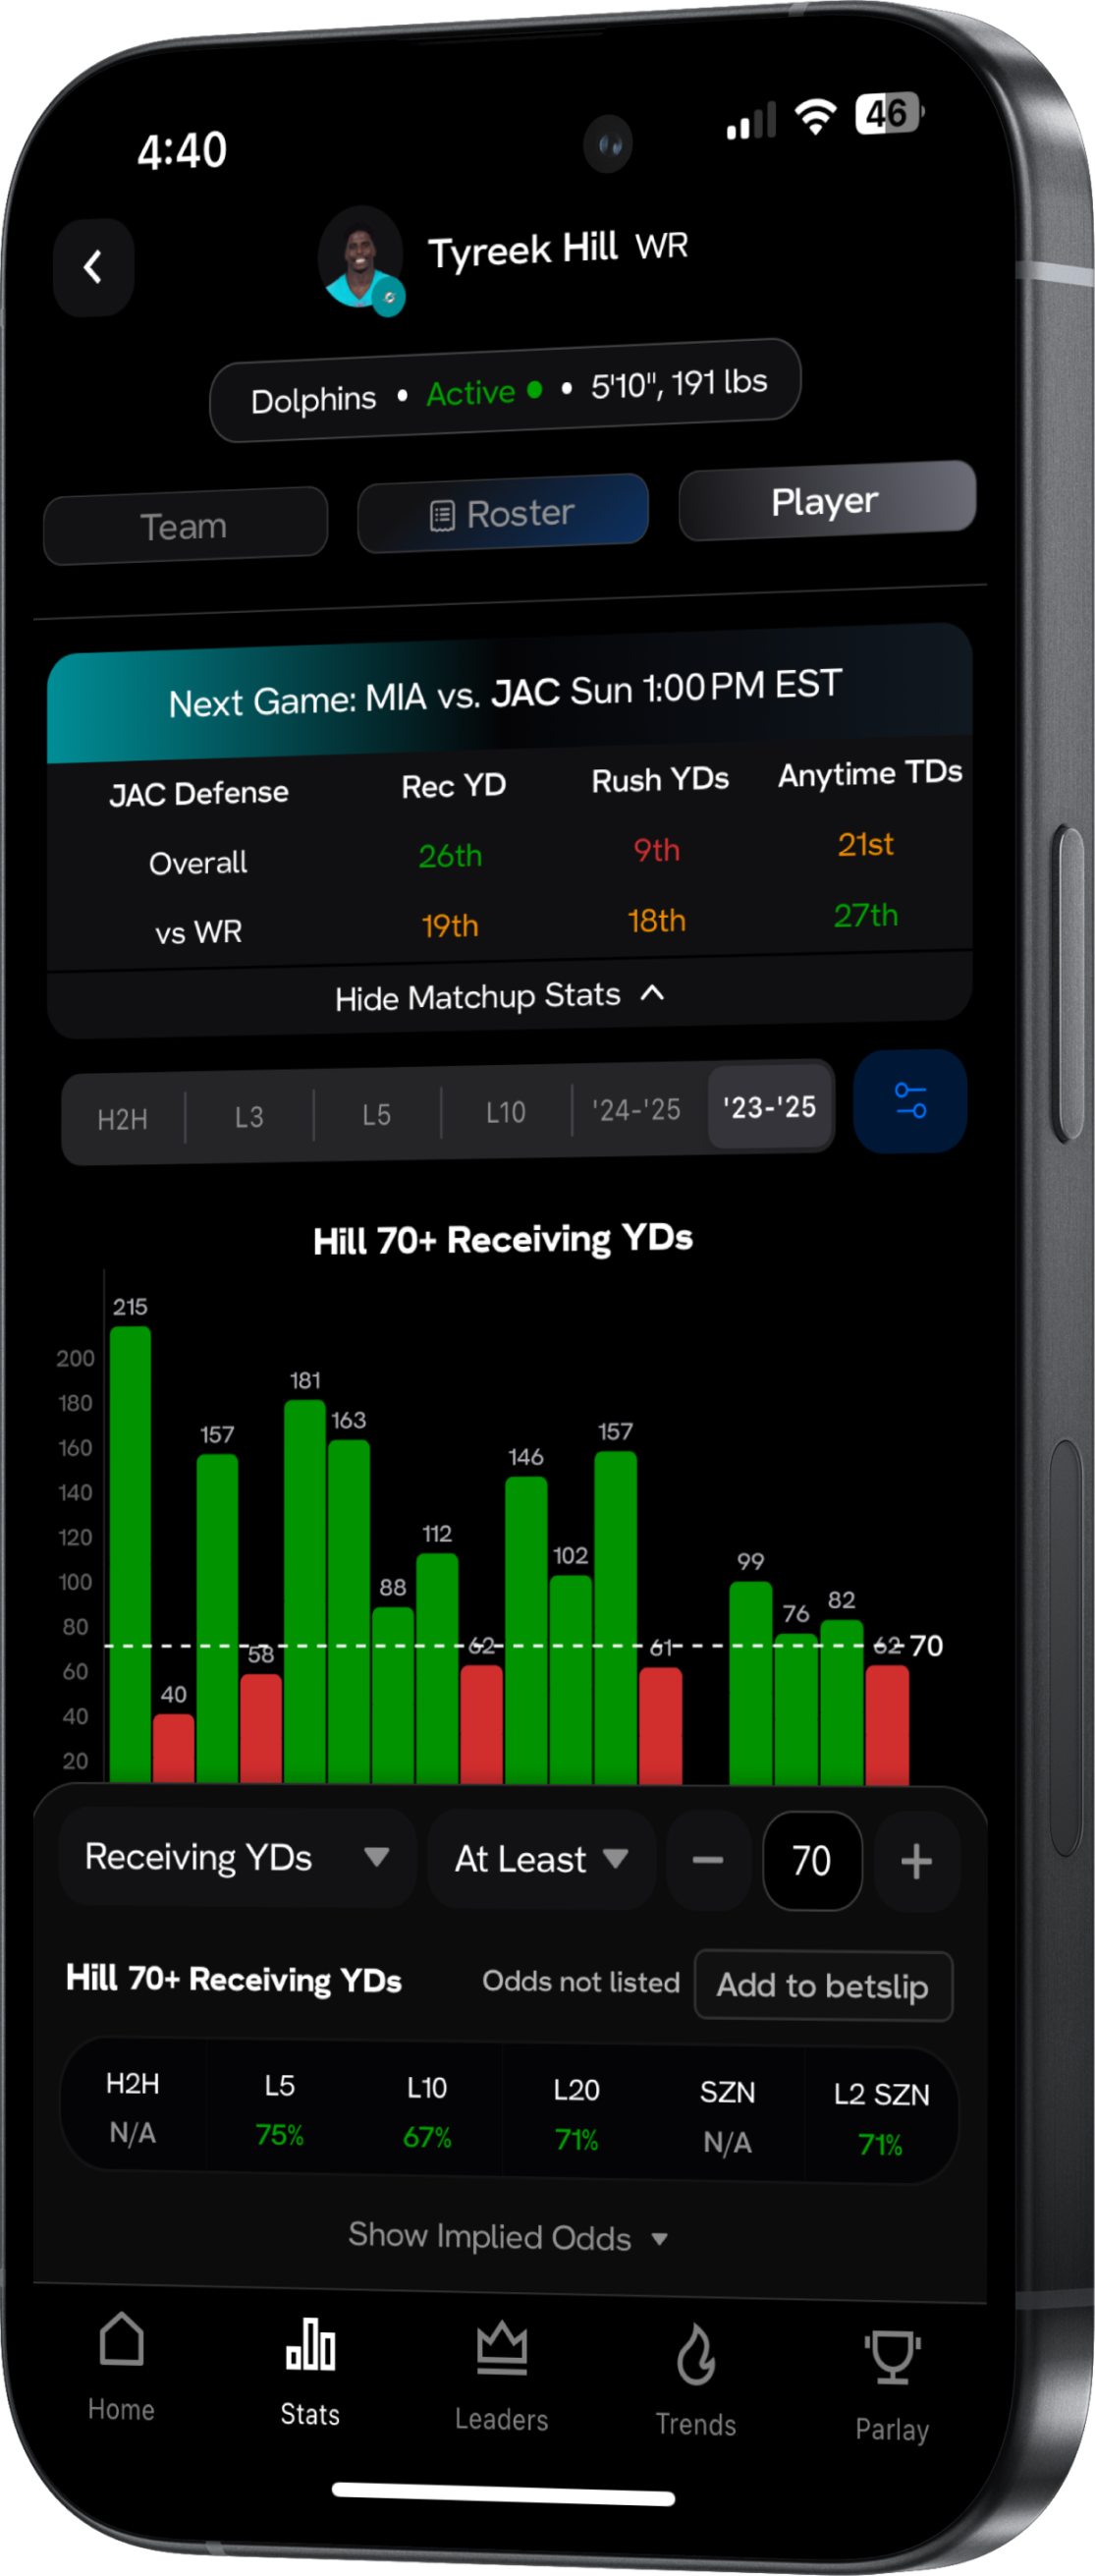
Look up any player or team to view in depth analytics showing hit rates, charts, game logs, and matchup info. Apply powerful filters like H2H, playoffs, minutes played, with or without teammates, opponent strength, and more to slice and dice the data.
- Parlay Optimizer
Enter any SGP or SGP+ you're considering and get innovative analytics with hit rates broken down by leg and projected probability for the parlay. Get insights on which legs to cut and which to increase, based on the cold hard data.
- Leaderboards
View player rankings by hit rate for any prop you'd like to research (for example, 25+ points or 10+ rebounds) over the entire season or recent time frames (last 5, last 10, last 20 games) to get an idea of which players are on hot streaks.
- Trends (You are here)
View the most valuable plays currently being offered by sportsbooks, sorted by edge. This tool breaks down the differences between the implied odds of lines being offered by sportsbooks and their historical hit rates to bring you strong plays to add to your betslip.
We’ll walk you through how to use each tool using examples along the way. HOF Bets is the shiny new weapon in your sports betting arsenal, and this article is a training session to prepare you for optimal performance next time you bet.
Trends
Trends is the newest feature we offer and potentially the most powerful one yet. With this tool, you can examine which player props and game lines are trending in the right direction by examining their edge compared to what odds a sports book is offering for their line.
This can be one of the most powerful places to come to when you want to find ideas for plays, as it is designed to bring the plays with the greatest potential value straight to you, rather than you having to go through and go through the labor of finding these plays on your own.
Trends is an incredible tool, but to use it to its best, you need to understand one key concept that the tool is centered around: Edge.
Edge, simply put, is the difference between the percentage a player or team hits a line at compared to the percentage that a books odds would suggest it has hit at. In other words, a book offering lines of +100 would suggest that a line should hit exactly 50% of the time, but if a line has hit more often than that, the edge on this bet would be positive.
To give a more clear example, let’s dive into the Trends page and see what our highest EV play for today is.

The prop bet of Josh Allen u0.5 Interceptions has an edge of 53% on the season. Allen has yet to throw a pick this year, which gives this bet a 100% hit rate in that time frame. Meanwhile, ESPNBet has the prop priced in at odds of +115, meaning that they think it is more likely than not that Allen will throw an interception. More specifically, these odds translate to an implied probability of 47% of hitting. Therefore, the edge on this place is simply calculated as [Observed Hit Rate] – [Implied Probability of Sportsbook Odds] = 100% – 47% = 53%.
While the concept can be a bit tricky at first, it comes more easily with time. Now that we have that basic understanding, let's dive into the rest of the tool. Here is what the Trends page looks like when you first open it up.

For each prop, the player will be displayed alongside some information about them: their hit rate for this line over different time spans and in head to head competition, their matchup grade, and finally, their edge alongside with the odds that this prop is being offered at.
There are a few different ways to navigate through the tab. First, you can decide whether you want to examine Player Props or Team Props by clicking the tab at the top. For example, if we wanted to see trending Team plays, this is what we would see:

Next, you can switch the time horizon that we are calculating edge from. By default, the tool will be set up for the entire season, but if you prefer to look at a longer or shorter period of time, the listing of plays will automatically update to reflect these changes.

Beyond this, you have the ability to apply a number of powerful filters that can make this tool as customized as you want. From deciding which games you want to explore to limiting the sportsbooks that you want to see line from, there are a number of ways to narrow down your plays and make sure that you are finding the perfect plays for yourself. Below is an example of the different types of filters that you can apply.

After clicking apply, all of these filters will automatically be applied to your Trends, just how it was with other changes we have applied so far.
Utilizing these tools, you can use Trends as a powerful tool for jumpstarting your research. If you already have a type of bet in mind or if you need some inspiration, this is a phenomenal resource for leading you to finding the highest value bets out there.
Need help with some of our other tools? Check out our other guides linked above.
Take the question out of betting research with HOF Bets. Optimize your bets using sports betting analytics like these and many more, available on our platform at hofbets.com or by downloading our new iOS app here. Get started with us today for the best player prop and sports betting research.


